Spring Boot 3 Observability with Grafana Stack
In this blog post - Spring Boot 3 Observability with Grafana Stack, we will learn how to implement Observability in our Spring Boot applications using Grafana Stack which comprises Grafana, Loki, and Tempo.

What is Observability?
In a nutshell, Observability is the process of understanding the internal state of the application with the help of different indicators such as Logs, Metrics, and Tracing information.
For a more detailed explanation, have a look at this article.
We will see how to implement Observability for a sample loan processing system built with Spring Boot 3 using the Grafana Stack.
Grafana Stack
Grafana Stack comprises about 3 softwares:
Grafana: This is the most widely used tool that helps to monitor and visualize the metrics of our application. Users can visualize the metrics by building different dashboards and can use different kinds of charts to visualize the metrics. We can also configure alerts to be notified whenever a metric reaches a certain required threshold.
To collect metrics, we will be using Prometheus, a metrics aggregation tool.
Loki: is a Log Aggregation tool that receives the logs from our application and indexes the logs to be visualized using Grafana.
Tempo: is used as a distributed tracing tool, which can track requests that span across different systems.
Implementing Observability
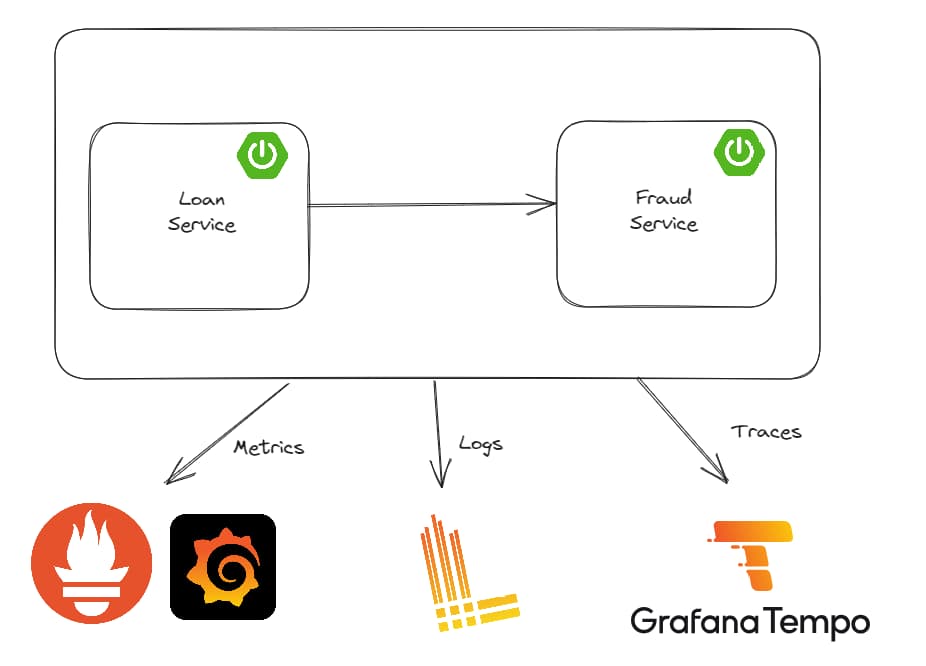
The below picture shows you a high-level overview of our project and how tools like Grafana, Loki, and Tempo fit into our overall architecture.

We have a loan-service that is responsible for accepting requests for loans and this request is validated against a fraud-service that verifies if the applicant is on the fraud list.
You can find the source code of this application at - github.com/SaiUpadhyayula/springboot3-obser..
This tutorial will only concentrate on implementing the observability aspects of the application, the initial working version of the application can be found in the branch - start-here.
The application is built as a maven multi-module project, where loan-service and fraud-service are created as maven modules.
Logging
Let's start with implementing logging in our application. To send our application logs to Loki, we have to add the below dependency to the pom.xml of both loan-service and fraud-service.
    <dependency>
        <groupId>com.github.loki4j</groupId>
        <artifactId>loki-logback-appender</artifactId>
        <version>1.3.2</version>
    </dependency>
The loki-logback-appender adds the necessary integration with Loki with the help of the Logback logging library.
Next, we have to define a logback-spring.xml file inside the src/main/resources which contains necessary information about how to structure our logs and where to send the logs (in other words it contains the information about Loki URL).
<?xml version="1.0" encoding="UTF-8"?>
<configuration>
    <include resource="org/springframework/boot/logging/logback/base.xml"/>
    <springProperty scope="context" name="appName" source="spring.application.name"/>

    <appender name="LOKI" class="com.github.loki4j.logback.Loki4jAppender">
        <http>
            <url>http://localhost:3100/loki/api/v1/push</url>
        </http>
        <format>
            <label>
                <pattern>application=${appName},host=${HOSTNAME},level=%level</pattern>
            </label>
            <message>
                <pattern>${FILE_LOG_PATTERN}</pattern>
            </message>
            <sortByTime>true</sortByTime>
        </format>
    </appender>

    <root level="INFO">
        <appender-ref ref="LOKI"/>
    </root>
</configuration>
The <appender> defines the Loki4JAppender, which contains the reference to the Loki url under the <url> tag. It also defines the log pattern using the <pattern> tag which is defined as application=${app.name}, host=${HOSTNAME}, level=%level, where we display the application name which is defined in the <springProperty> tag, host, and the log level, which is defined as INFO under the <root> tag.
That's all we need to do to implement logging using Loki. You can download and run Loki on your machine using Docker. In the sample project, I am using docker-compose, add the below Loki configuration in the docker-compose.yml file:
loki:
  image: grafana/loki:main
  command: ['-config.file=/etc/loki/local-config.yaml']
  ports:
    - '3100:3100'
Now let's see how to implement Metrics using Prometheus and Grafana.
Metrics
Metrics can be any kind of measurable information about our application like JVM statistics, Thread Count, Heap Memory information, etc. To collect metrics of our application, we need to first enable Spring Boot Actuator in our project by adding the below dependency:
        <dependency>
            <groupId>org.springframework.boot</groupId>
            <artifactId>spring-boot-starter-actuator</artifactId>
        </dependency>
Next, we have to add another dependency to expose the metrics of our application, Spring Boot uses Micrometer to collect metrics, and by adding the below dependency we can configure Micrometer to expose an endpoint that can be scraped by Prometheus.
        <dependency>
            <groupId>io.micrometer</groupId>
            <artifactId>micrometer-registry-prometheus</artifactId>
            <scope>runtime</scope>
        </dependency>
To see different metrics exposed by Spring Boot you can refer to this link from Spring Boot documentation - docs.spring.io/spring-boot/docs/current/ref..
The next step is to add some properties to our application.yml file.
management.endpoints.web.exposure.include=health, info, metrics, prometheus
management.metrics.distribution.percentiles-histogram.http.server.requests=true
management.observations.key-values.application=loan-service
The property - management.endpoints.web.exposure.include=health, info, metrics, prometheus exposes the endpoints health, info, metrics, and prometheus through the actuator.
Next, we are defining a property called management.metrics.distribution.percentiles-histogram.http.server.requests=true which is used by the micrometer to gather the metrics in the form of a histogram and send it to Prometheus. You can read more about this concept here - micrometer.io/docs/concepts#_histograms_and...
After adding the above properties run both applications and open the URL - localhost:8080/actuator/prometheus to see different metrics that are exposed by the micrometer.
You can run Prometheus by adding the below entry in the docker-compose.yml file
prometheus:
  image: prom/prometheus:v2.46.0
  command:
    - --enable-feature=exemplar-storage
    - --config.file=/etc/prometheus/prometheus.yml
  volumes:
    - ./docker/prometheus/prometheus.yml:/etc/prometheus/prometheus.yml:ro
  ports:
    - '9090:9090'
We need a configuration file, to tell Prometheus where it can find the necessary metrics to scrape. For that, we need to create a file called prometheus.yml with the following content.
global:
  scrape_interval: 2s
  evaluation_interval: 2s

scrape_configs:
  - job_name: 'prometheus'
    static_configs:
      - targets: ['prometheus:9090']
  - job_name: 'loan-service'
    metrics_path: '/actuator/prometheus'
    static_configs:
      - targets: ['host.docker.internal:8080'] ## only for demo purposes don't use host.docker.internal in production
  - job_name: 'fraud-detection'
    metrics_path: '/actuator/prometheus'
    static_configs:
      - targets: ['host.docker.internal:8081'] ## only for demo purposes don't use host.docker.internal in production
Under the global field, we defined the scrape and evaluation interval as 2s. In the scrape_configs section, we have 3 jobs, one for prometheus, loan-service, and fraud-detection service. Notice that to scrape the loan-service and fraud-detection services we defined the URL of both the services and the metrics path as - /actuator/prometheus
Tracing
Now let's go ahead and implement Distributed Tracing using Tempo. For that, we need to add some more dependencies.
Prior to Spring Boot 3, we used to add the Spring Cloud Sleuth dependency to add distributed tracing capabilities to our application, but from Spring Boot 3, Spring Cloud Sleuth is no longer needed and this is replaced by the Micrometer Tracing Project. To add the support, add the below dependencies:
        <dependency>
            <groupId>io.micrometer</groupId>
            <artifactId>micrometer-tracing-bridge-brave</artifactId>
        </dependency>
        <dependency>
            <groupId>io.zipkin.reporter2</groupId>
            <artifactId>zipkin-reporter-brave</artifactId>
        </dependency>
micrometer-tracing-bridge-brave is the dependency that does all the magic and adds distributed tracing for our application. Whereas zipkin-reporter-brave will exportthe tracing information to Tempo.
NOTE: You can also use other tracing implementation like OpenTelemetry - micrometer-tracing-bridge-otel dependency instead of Brave - micrometer-tracing-bridge-brave
If you want to trace the calls to the database, as we are using Spring Data JDBC, we can add the dependency datasource-micrometer-spring-boot dependency.
        <dependency>
            <groupId>net.ttddyy.observation</groupId>
            <artifactId>datasource-micrometer-spring-boot</artifactId>
            <version>1.0.1</version>
        </dependency>
As we are using a RestTemplate to call fraud-detection service from loan-service , the traceId and spanId are generated and propagated automatically.
But if you want to create manual tracing for specific calls you can use the Observation API and the @Observed annotation.
For example, as we wanted to trace the calls to the database, we can do that by adding the @Observed annotation on the LoanRepository interface.
@Repository
@RequiredArgsConstructor
@Observed
public class LoanRepository {

    private final JdbcClient jdbcClient;

    .....
    .....
    .....
}
Next, we need to define a bean of type ObservedAspect we can do that by creating a class called ObservationConfig.java
package com.programming.techie.loans.config;

import io.micrometer.observation.ObservationRegistry;
import io.micrometer.observation.aop.ObservedAspect;
import org.springframework.context.annotation.Bean;
import org.springframework.context.annotation.Configuration;

@Configuration
public class ObservationConfig {
    @Bean
    ObservedAspect observedAspect(ObservationRegistry registry) {
        return new ObservedAspect(registry);
    }
}
Finally, to enable the Aspect Oriented Programming, we need to add the spring-boot-starter-aop dependency.
        <dependency>
            <groupId>org.springframework.boot</groupId>
            <artifactId>spring-boot-starter-aop</artifactId>
        </dependency>
Micrometer Tracing will only send 10% of the traces it generates to Tempo, just to avoid overwhelming it with a lot of requests. We can set it to 100% by adding the below property to our application.yml file
management.tracing.sampling.probability=1.0
Finally, you can run Tempo using docker, by adding the below piece of code inside the docker-compose.yml file:
tempo:
  image: grafana/tempo:2.2.2
  command: ['-config.file=/etc/tempo.yaml']
  volumes:
    - ./docker/tempo/tempo.yml:/etc/tempo.yaml:ro
    - ./docker/tempo/tempo-data:/tmp/tempo
  ports:
    - '3110:3100' # Tempo
    - '9411:9411' # zipkin
Finally, we need to configure a file called tempo.yml file to store the necessary settings to be used in Tempo. I created this file under the docker folder
server:
  http_listen_port: 3200

distributor:
  receivers:
    zipkin:

storage:
  trace:
    backend: local
    local:
      path: /tmp/tempo/blocks
You can observe that we are referring to this file inside the docker-compose service, and we are mounting this file into the /etc/ location of the container.
Running Grafana
Before testing our implementation, let's also see how to run Grafana using Docker. After all, this is what brings all the services like Tempo, Loki, and Prometheus together and visualizes the information produced by our services.
grafana:
  image: grafana/grafana:10.1.0
  volumes:
    - ./docker/grafana:/etc/grafana/provisioning/datasources:ro
  environment:
    - GF_AUTH_ANONYMOUS_ENABLED=true
    - GF_AUTH_ANONYMOUS_ORG_ROLE=Admin
    - GF_AUTH_DISABLE_LOGIN_FORM=true
  ports:
    - '3000:3000'
The above configuration will run Grafana by disabling the login and authentication, do not use this configuration in Production.
Also for Grafana, we need to define the data sources from which it needs to gather the information to visualize, for that let's create a file called datasources.yml
apiVersion: 1

datasources:
  - name: Prometheus
    type: prometheus
    access: proxy
    url: http://prometheus:9090
    editable: false
    jsonData:
      httpMethod: POST
      exemplarTraceIdDestinations:
        - name: trace_id
          datasourceUid: tempo
  - name: Tempo
    type: tempo
    access: proxy
    orgId: 1
    url: http://tempo:3200
    basicAuth: false
    isDefault: true
    version: 1
    editable: false
    apiVersion: 1
    uid: tempo
    jsonData:
      httpMethod: GET
      tracesToLogs:
        datasourceUid: 'loki'
      nodeGraph:
        enabled: true
  - name: Loki
    type: loki
    uid: loki
    access: proxy
    orgId: 1
    url: http://loki:3100
    basicAuth: false
    isDefault: false
    version: 1
    editable: false
    apiVersion: 1
    jsonData:
      derivedFields:
        - datasourceUid: tempo
            matcherRegex: \[.+,(.+?),
            name: TraceID
            url: $${__value.raw}
This file defines all the data sources like Prometheus, Loki, and Tempo and references to the respective URLs.
Testing
Okay, now it's Testing Time.
Start all the services by running the command:
docker compose up -d
Also, run both the loan-service and fraud-detection services.
After you make some calls to GET/loan and POST/loan, let's first open Loki and check for logs.
Click on the toggle menu and click on 'Explore'
Under the dropdown select - 'Loki' and run the query with your desired parameters, e.g.: select the application label as - loan-service.

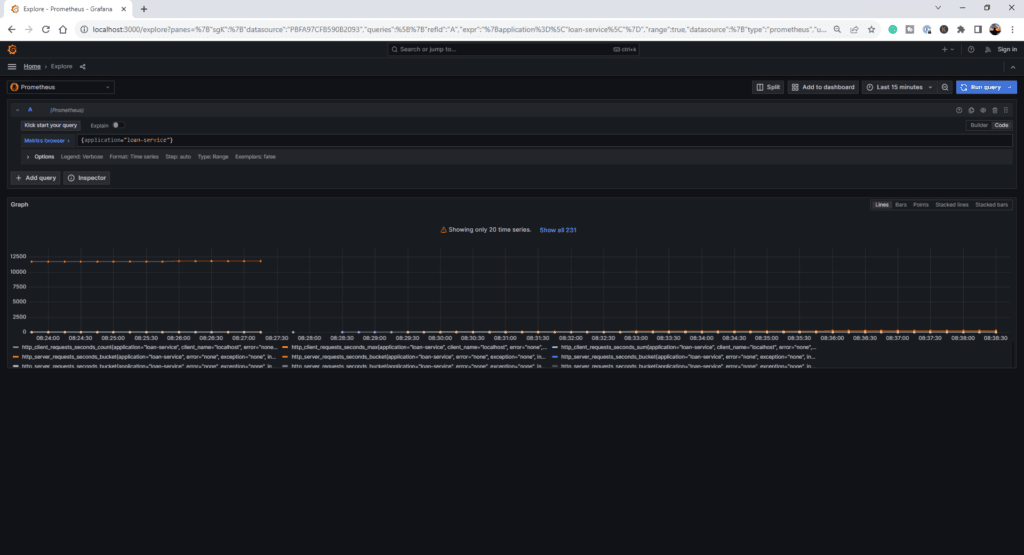
Now let's open Prometheus, and apply the same filter, you should see the results below:

Note down the traceId from the logs that are generated by the GET/loan (or) POST/loan calls.

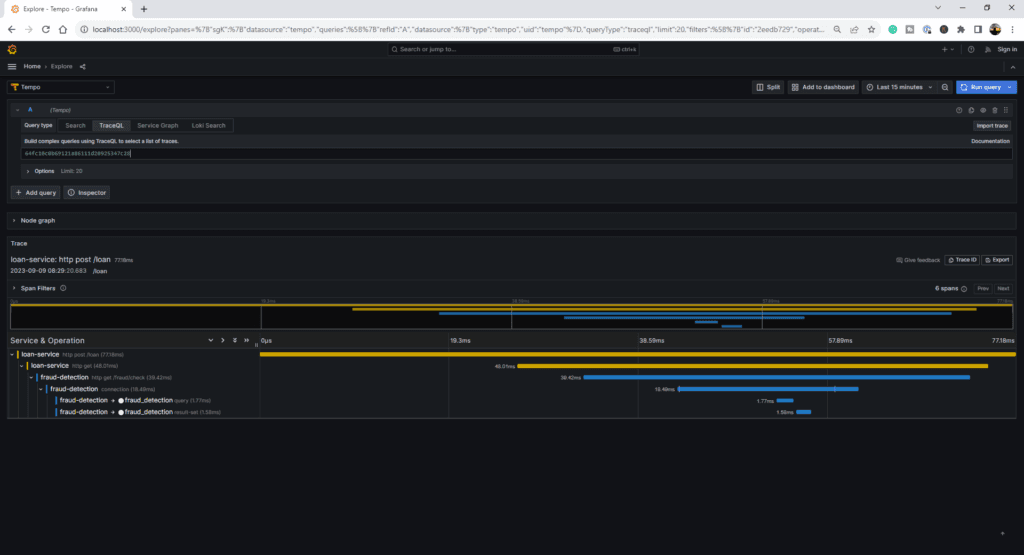
Now open Tempo, go to the Query Type - TraceQL, paste the traceId, and press Shift-Enter.
You should see the tracing information of that particular request.
You can observe from the below image that the fraud-detection service also displays the calls made to the database, thanks to the datasource-micrometer-spring-boot dependency we added before.

Conclusion
Observability plays a vital role in ensuring that our applications are running as expected and provides us insights into the inner state of the application.
You can find the complete source code of this application on Github - https://github.com/Malalakshmi/Microservices_Application_Main.git